RightMark Audio Analyzer test report
| Testing device | E-mu1212m |
| Sampling mode | 24-bit, 48 kHz |
| Interface | |
| Testing chain | External loopback (line-out - line-in) |
| RMAA Version | 6.0.5 |
| 20 Hz - 20 kHz filter | ON |
| Normalize amplitude | ON |
| Mono mode | OFF |
| Calibration singal, Hz | 1000 |
| Polarity | inverted/inverted |
Summary
| Frequency response (from 40 Hz to 15 kHz), dB | +0.02, -0.13 |
Very good |
| Noise level, dB (A) | -113.9 |
Excellent |
| Dynamic range, dB (A) | 113.8 |
Excellent |
| THD, % | 0.0004 |
Excellent |
| THD + Noise, dB (A) | -100.4 |
Excellent |
| IMD + Noise, % | 0.0013 |
Excellent |
| Stereo crosstalk, dB | -114.0 |
Excellent |
| IMD at 10 kHz, % | 0.0016 |
Excellent |
| General performance | Excellent |
Frequency response
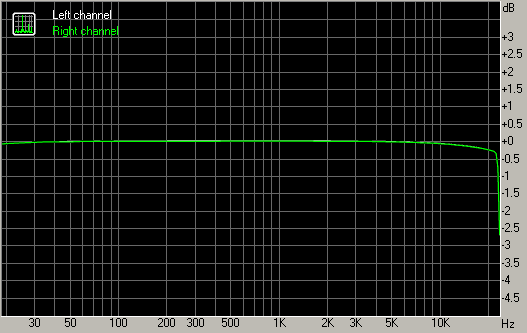
| From 20 Hz to 20 kHz, dB | -0.23, +0.02 |
| From 40 Hz to 15 kHz, dB | -0.13, +0.02 |
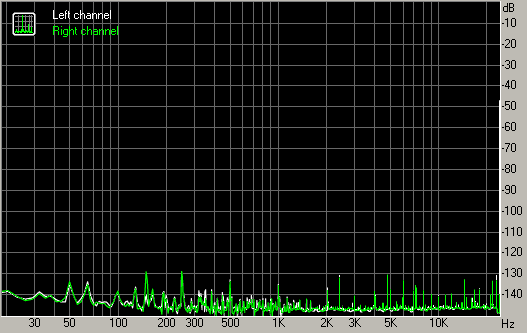
Noise level
Left |
Right |
|
| RMS power, dB | -112.8 |
-112.7 |
| RMS power (A-weighted), dB | -113.9 |
-113.9 |
| Peak level, dB FS | -90.7 |
-90.7 |
| DC offset, % | +0.0 |
+0.0 |
Dynamic range
Left |
Right |
|
| Dynamic range, dB | +112.7 |
+112.7 |
| Dynamic range (A-weighted), dB | +113.8 |
+113.8 |
| DC offset, % | -0.00 |
-0.00 |
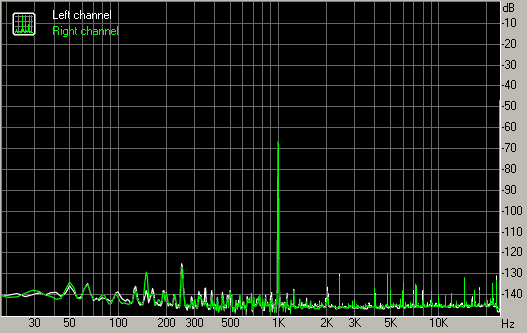
THD + Noise (at -3 dB FS)
Left |
Right |
|
| THD, % | +0.0004 |
+0.0004 |
| THD + Noise, % | +0.0010 |
+0.0010 |
| THD + Noise (A-weighted), % | +0.0009 |
+0.0010 |
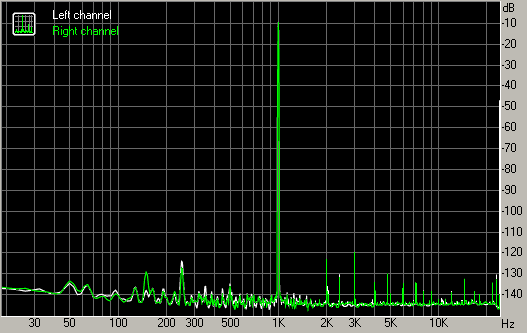
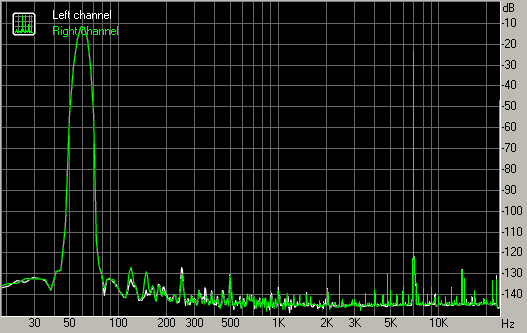
Intermodulation distortion
Left |
Right |
|
| IMD + Noise, % | +0.0013 |
+0.0013 |
| IMD + Noise (A-weighted), % | +0.0011 |
+0.0011 |
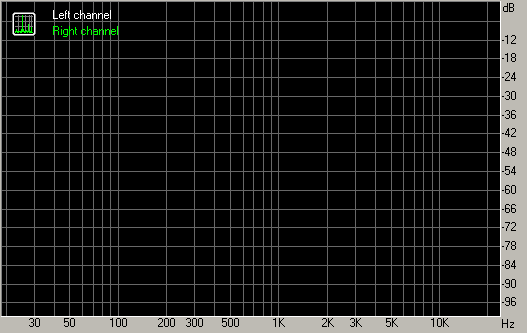
Stereo crosstalk
Left |
Right |
|
| Crosstalk at 100 Hz, dB | -111 |
-113 |
| Crosstalk at 1000 Hz, dB | -113 |
-113 |
| Crosstalk at 10000 Hz, dB | -109 |
-111 |
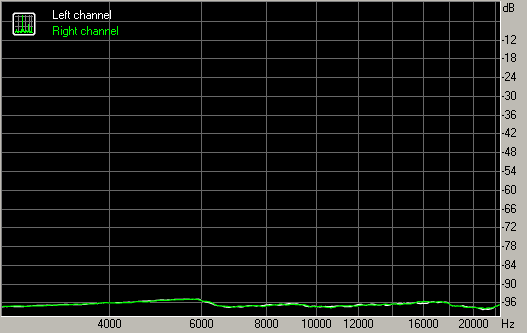
IMD (swept tones)
Left |
Right |
|
| IMD + Noise at 5000 Hz, | 0.0018 |
0.0017 |
| IMD + Noise at 10000 Hz, | 0.0014 |
0.0014 |
| IMD + Noise at 15000 Hz, | 0.0016 |
0.0015 |